Blog

6 major data management risks — and how to tackle them

Why data trust matters to your customers
How business systems analysts can make data more accessible

Solving data sharing in a hybrid working world

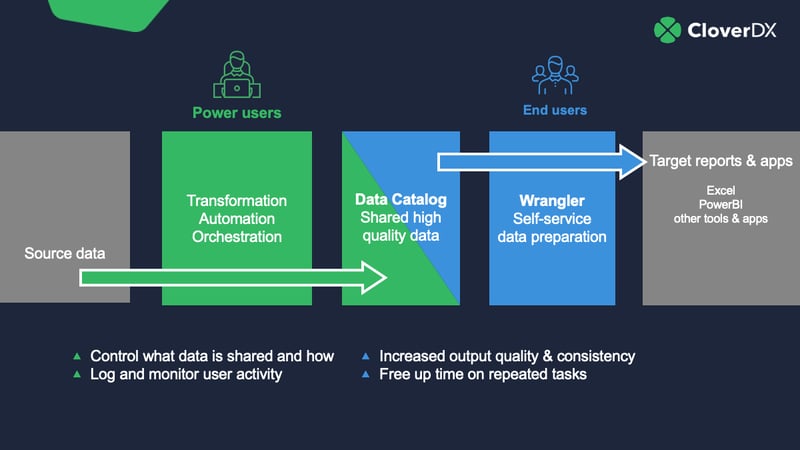
How self-service analytics can solve your productivity struggles

5 ways to reduce friction between IT and business users

Using data collaboration to improve your business outcomes

You can’t trust your business data. Here’s why.